The Monday production huddle at Northstar Components started the way they all do: yesterday’s throughput, this week’s build plan, which customers are hot.
“Are we back on schedule for A17?” the COO asked.
“Yes,” said Planning, pointing to an Excel tracker.
“Not exactly,” said Finance, reading from the ERP.
Quality glanced at her notebook. “If you include the rework lot, no.”
Three answers. One plant. A customer escalation at 2 p.m.
They didn’t decide. They debated.
The Cost You Never Line‑Item
By lunch, supervisors were exporting ERP data (jobs, routings, labor, movements) and stitching it to a forest of spreadsheets named A17_ShipPlan_FINAL_v9.xlsx. Maintenance had a downtime log on SharePoint; the MES used different codes; the warehouse tracked cycle counts in yet another file. The data wasn’t wrong—it was disconnected.
Leadership pays for that in ways that don’t show on a PO:
- Decision latency: Hours reconciling numbers before anyone moves.
- Overtime & expedites: “Just to be safe,” because schedule adherence isn’t trusted.
- Erosion of confidence: Teams argue definitions instead of outcomes.
“We don’t have a dashboard problem,” said Lena, the IT Director. “We have a foundation problem.”
The Inciting Incident
An OEM threatened chargebacks for late deliveries. Operations blamed extended changeovers; Quality saw FPY dip; Planning flagged supplier lead‑time slip. Same plant, different truths.
“We need one story,” the COO said. “Pick the tool and make it work.”
Lena didn’t pick a tool. She picked a contract:
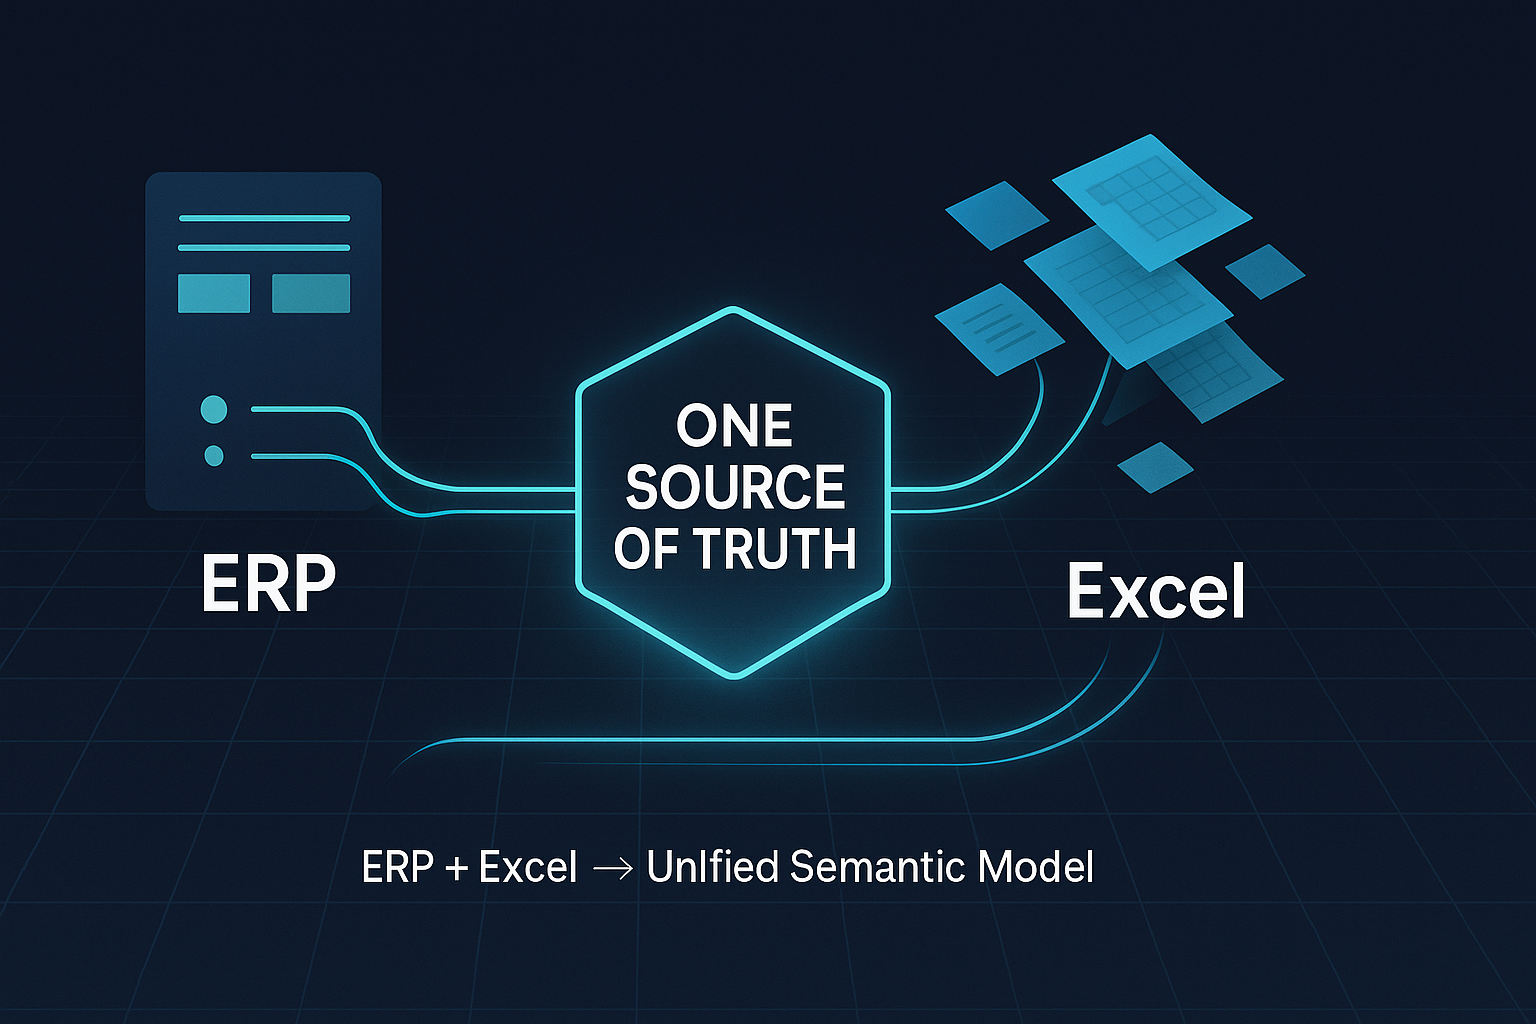
One source of truth will live in Power BI, fed by the ERP (and friends), with shared definitions, certified data products, and a semantic model. Excel can stay—but only as a window into the certified truth, not a place where math goes to improvise.
It sounded slower. It was the only way to go faster.
Act II — Pouring the Concrete (Without Stopping the Line)
A 90‑day sequence. Not big‑bang. One value stream, tight scope, visible wins.
Days 0–30: Make the Truth Findable
- Choose ten executive KPIs: OEE, First Pass Yield, Scrap Rate, Setup Time, Schedule Adherence, On‑Time Delivery, WIP Turns, Inventory at Risk, MTBF, MTTR.
- Write plain‑English definitions with owners. Not code—words.
- Land raw data as‑is from ERP, MES, CMMS, WMS, Quality, and those Excel trackers. Keep history and metadata; no “clever” fixes yet.
- Add automatic tests that fail loudly: key reconciliation across systems, timestamp sanity (no negative durations), UoM conversions, no orphan jobs/routings.
- If a test fails, the pipeline fails—before the 6 a.m. tier meeting.
Days 31–60: Teach Data to Tell One Story
- Curate two domains first: Production & Quality.
- Production fact: counts by minute/job/revision/work center; changeovers explicit, not “misc. downtime.”
- Quality fact: defects by code/station tied to the same revision and lot used in production and shipping.
- Master data: unify machine/work‑center/asset IDs; effective‑dated BOMs so analysis uses the recipe that actually ran.
- Move business logic out of spreadsheets and visuals into the Power BI semantic model:
- OEE = Availability × Performance × Quality with a single downtime taxonomy.
- FPY excludes rework—everywhere.
- Schedule Adherence references the frozen schedule.
- Inventory at Risk = BOM explosion vs. on‑hand/lead time per revision.
- Enforce row‑level security via Entra ID groups. Finance sees costed views; line leads see their work centers.
- Let Excel live—on a leash: connect pivots to the certified Power BI dataset; kill CSV copy‑paste.
Days 61–90: Replace Debate with Speed
- Pilot on Line 3 with two executive asks:
- “Yesterday’s OEE by hour in under five seconds.”
- “Yield hit during the feeder issue and its impact on late orders.”
- Enable incremental refresh + a few aggregations; visuals snap open.
- Show lineage (OEE ← Production Facts ← ERP + MES) and owners.
- Publish a glossary: “Setup Time = last good part on SKU A → first good part on SKU B.”
- Retire duplicate feeds as the certified model goes live.
Act III — The Call That Didn’t Hurt
Friday’s OEM call opened with, “Are you back on schedule?”
“Yes,” said the COO, calm. “Schedule adherence is 97.2% this week. The miss was a 42‑minute changeover variance from a feeder alignment; FPY dipped 2.4 points during that window…”
No one asked, “Which system says that?” The slide carried a small, unglamorous badge: Certified.
Planning adjusted changeover rules. Maintenance updated PM intervals. Quality tightened defect codes. Finance reconciled faster because scrap was counted once, the same way, across ERP and the shop floor.
What Changed (and Why It Stuck)
- Decisions got faster because definitions stopped moving.
- Throughput improved as micro‑stops surfaced consistently and early.
- Cost accuracy improved because logic lived once—in the model.
- Adoption surged because Power BI served dashboards and Excel pivots with the same truth.
- Audit risk dropped with governed access, lineage, and tests that fail before the floor meeting.
- New questions didn’t trigger a data fire drill. The foundation handled them.
Executive Takeaways (C‑Level & IT)
- One source of truth isn’t a tool; it’s a contract. Power BI is the delivery layer; the win is shared definitions, certified data products, and ownership.
- Keep Excel as a consumer, not a factory.
- Ship value in slices. One line, a handful of KPIs, two sprints. Retire duplicates as you certify.
- Automate governance. Quality checks, lineage, and access must be code.
- Measure success: decision latency ↓, month‑end reconciliation time ↓, % of reports on certified datasets ↑, P95 query time < 5s.